Penn State University Example
Penn State University Example
Users at Penn State University noticed that data movement activities (using tools like GridFTP) were always slow. For whatever reason downloading and uploading data always seemed to go slow. The problem got worse with sites that were physically separated by a great distance.
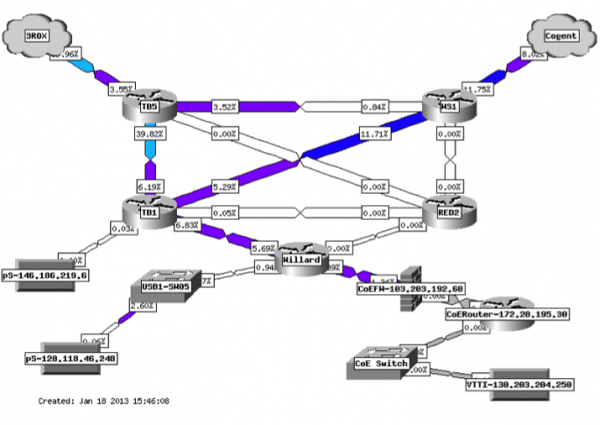
Penn State had adopted perfSONAR as a test infrastructure at certain points in their network, but not located where this particular set of users was located. It was determined that a test node should be deployed. The network map below shows the general infrastructure - the user was located in the lower right:
After deployment, a couple of tests were run. Here are the results of one of those tests:
jzurawski@ssstatecollege:~> nuttcp -T 30 -i 1 -p 5679 -P 5678 64.57.16.22
    5.8125 MB /   1.00 sec =   48.7565 Mbps     0 retrans
    6.1875 MB /   1.00 sec =   51.8886 Mbps     0 retrans
…
    6.1250 MB /   1.00 sec =   51.3957 Mbps     0 retrans
    6.1250 MB /   1.00 sec =   51.3927 Mbps     0 retrans

  184.3515 MB /  30.17 sec =   51.2573 Mbps 0 %TX 1 %RX 0 retrans 9.85 ms RTT
In this case low throughput is in fact observed, and we see no TCP retransmissions. Using these observations as a basis, an investigation was started within the Penn State University network. It was decided that the best way to figure out if this was a Wide Area problem (e.g. something outside of the campus control) versus a Local Area problem (something within the control of Penn State University) was to examine the perfSONAR tests already configured at the border of the campus. These results are not shown, but throughput was observed to be very high (near 10Gbps) to a test point far away from Penn State. This indicated that the location of the problem was within the Penn State network, between the border the user.
This is a powerful bit of debugging because:
- It is tempting to think that on a long path, the problems observed between a local resource and a remote resource must be somewhere far away. As demonstrated in TCP Loss Explained, TCP performs well over a short distance, and worse as the latency increases.
- By revealing that the problem is not on the majority (90% or more) of the path, more time can be spent analyzing the local issues.
- By revealing the problem is local, there is no need to involve regional, national, or remote resources to debug a non-existent issue
The staff at Penn State now knows to look between the nodes to find the problem. There are several possible courses of action:
- Investigate the load on the links between the resources, to see if anything is overly congested
- Investigate the buffer settings of all switches and firewalls in the path, to see if they are large enough to support the Bandwidth Delay Product. As a reminder, the Bandwidth Delay Product (BDP) is a function of the latency, available memory, and expectation of bandwidth. A helpful calculator can be found here: https://www.switch.ch/network/tools/tcp_throughput/. For example, to be able to achieve a bandwidth of 1Gbps over an 80ms path, there needs to be at least 10MB of buffer available at each hop in the path to facilitate TCP's operation. If any part of the path doesn't have this much memory, it will be impossible to reach the bandwidth expectation. In fact each hop should have significantly more buffer available, to facilitate the use by other flows that will no doubt be passing through the interface.
- Investigate the performance of the firewall in the path, to determine if it is
- Taking too long to process packets, thus causing TCP to time out and re-send data
- Manipulating packet headers to adjust the requested window size, thus keeping throughput low
Looking closer at our observation, we see a key fact to this problem: zero TCP retransmissions, but low throughput. This typically means that we are not dropping packets, but something is not allowing TCP perform at a higher speed, e.g. could something not be allowing the TCP window to scale? In situations like this, the first thing to check is the end hosts. There is an option in the Kernel of Linux that allows the TCP window to scale, its called net.ipv4.tcp_window_scaling (see also: https://en.wikipedia.org/wiki/TCP_window_scale_option). To check this, run a command on each end host:
[user@host ~]#sudo sysctl net.ipv4.tcp_window_scaling
net.ipv4.tcp_window_scaling = 1
If the option is set to1, we know that TCP should be able to increase the window size as the transfer allows. If this option is set to 0, it limits TCP to the default size of the window which typically is set to 64K. This can be checked with a similar command (the 2nd number is what we are interested in):
[user@host ~]# sudo sysctl net.ipv4.tcp_wmem
net.ipv4.tcp_wmem = 4096    65536    134217728
If the window is stuck at 64K, and won't grow, that limits the throughput we can achieve as the latency increases. Using the BDP calculator above, we can do the math on this:
- TCP window of 64 KByte and RTT of 1.0 ms <= 500.00 Mbit/sec.
- TCP window of 64 KByte and RTT of 5.0 ms <= 100.00 Mbit/sec.
- TCP window of 64 KByte and RTT of 10.0 ms <= 50.00 Mbit/sec.
- TCP window of 64 KByte and RTT of 50.0 ms <= 10.00 Mbit/sec.
Note that in our test above, NUTTCP told us the RTT between the hosts, it was about 10ms (e.g. 9.85 ms RTT). This means that we are artificially limited to a throughput of no more than 50Mbps no matter what we do.
The next order of business is to determine why the window isn't growing. This can be done by investigating the path again, and using TCPTrace/TCPDump between hosts. What we are hoping to find is a location where the TCP header switches from having been set (e.g. when the host sets it), to something else in the path that unsets it. The TCP header is constructed as such:
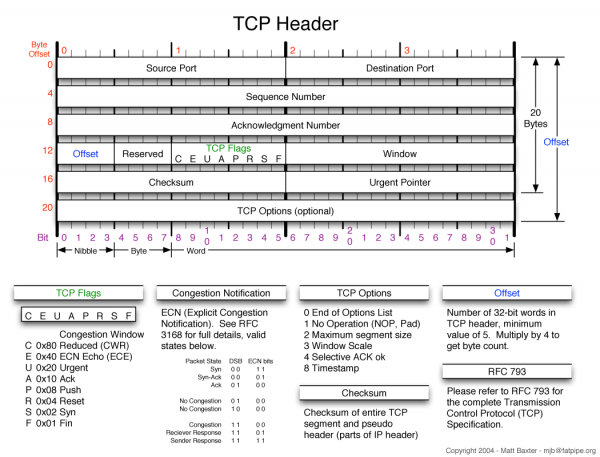
Window scaling is the #3 item in the TCP flags section. This portion of the debugging can take a while to complete, and does involve using tools like TCPTrace and Wireshark to find the location this is happening. After this segment by segment exercise, it was determined that the change was occurring after the traffic passed through a specific firewall. Packet headers would start with window scaling set on one end, and as a result of processing they would emerge with the option removed.
Documentation within the firewall (and online resources: https://kb.juniper.net/InfoCenter/index?page=content&id=KB19558&actp=search) suggested that the TCP flow sequence checking settings may need to be adjusted. After testing with this setting enabled and disabled, another run was performed that showed the following:
jzurawski@ssstatecollege:~> nuttcp -T 30 -i 1 -p 5679 -P 5678 64.57.16.22
   55.6875 MB /   1.00 sec =  467.0481 Mbps     0 retrans
   74.3750 MB /   1.00 sec =  623.5704 Mbps     0 retrans
   87.4375 MB /   1.00 sec =  733.4004 Mbps     0 retrans
…
   91.7500 MB /   1.00 sec =  770.0544 Mbps     0 retrans
   88.6875 MB /   1.00 sec =  743.5676 Mbps    28 retrans
   69.0625 MB /   1.00 sec =  578.9509 Mbps     0 retrans

 2300.8495 MB /  30.17 sec =  639.7338 Mbps 4 %TX 17 %RX 730 retrans 9.88 ms RTT
The firewall was re-writing packet headers, and not respecting the setting of this bit, on a consistent basis. After 3 days of operation, the following graph was produced on the outbound link for all traffic passing through the firewall:
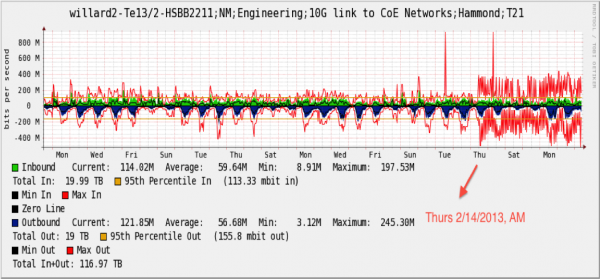
A large population of users was impacted, but only high performance users (those with large, long-lived flows) noticed and knew enough to complain.