George Mason University Packet Loss Example
George Mason University Packet Loss Example
This particular example illustrates the impacts of network problems, even if they are outside of your control. The campus illustrated in this example, George Mason University, did not experience a failure, but noticed low throughput numbers for a number of days. As quickly as the problem was noticed, it fixed itself. This explanation was done after the fact by outside parties to show how testing can be used to locate problems.
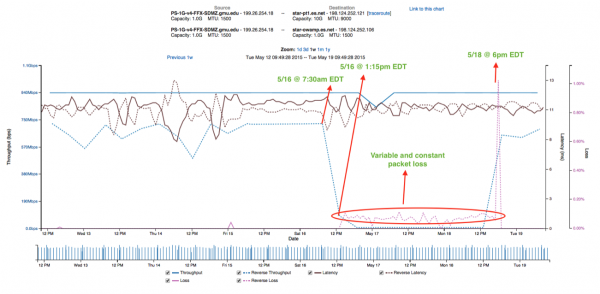
We first start with the graph that illustrates the problem. We see regular testing between ESnet and George Mason, and for a period of 2 days there was excessive TCP packet loss, coupled with low throughput:
The first step in figuring where this problem could have occurred is understanding the path between these two testers. Tests were established between ESnet in several locations:
- Washington DC
- Chicago IL
- El-Paso TX
- New York NY
- Sacramento CA
Looking through the various tests, and running traceroutes, some patterns emerged. In particular tests to Sacramento, El-Paso, and Washingon did not show the problem. Tests to New York and Chicago did. There were two sets of traceroutes we can look at based on this knowledge. The good paths first:
3  sunncr5-internet2.es.net (198.129.48.2)  10.277 ms  10.373 ms  10.439 ms
4  et-1-0-0.111.rtr.hous.net.internet2.edu (198.71.45.20)  55.655 ms  55.719 ms  55.711 ms
5  et-10-0-0.105.rtr.atla.net.internet2.edu (198.71.45.12)  70.067 ms  70.135 ms  70.128 ms
6  et-9-0-0.104.rtr.wash.net.internet2.edu (198.71.45.7)  69.869 ms  69.976 ms  69.820 ms
7  192.122.175.14 (192.122.175.14)  71.004 ms  71.088 ms  71.157 ms
8  gmu-router.v50.networkvirginia.net (192.70.138.62)  71.890 ms  71.934 ms  71.988 ms
and the bad paths second:
2  chiccr5-ip-a-starcr5.es.net (134.55.42.41)  0.673 ms  0.970 ms  1.300 ms
3  et-10-0-0.1235.rtr.chic.net.internet2.edu (64.57.30.0)  0.490 ms  0.559 ms  0.551 ms
4  et-7-0-0.115.rtr.wash.net.internet2.edu (198.71.45.57)  17.573 ms  17.675 ms  17.740 ms
5  192.122.175.14 (192.122.175.14)  18.803 ms  18.892 ms  18.965 ms
6  gmu-router.v50.networkvirginia.net (192.70.138.62)  19.816 ms  19.822 ms  19.891 ms
The key difference when entering inbound to GMU (note, this is the direction of the problem in the above graph) occurs at hops 6 in the first, and 4 in the second: et-7-0-0.
For the next stage of debugging, it helps to have access to regular SNMP records. In this case Internet2, a network provider in the United States, makes this information available: https://noc.net.internet2.edu/i2network/live-network-status.html
Finding data for the Internet2 Washington Router, specifically the et-7-0-0 interface revealed more about the problem. Matching the dates/times we see in the perfSONAR data between ESnet and GMU above, we captured the following graph:

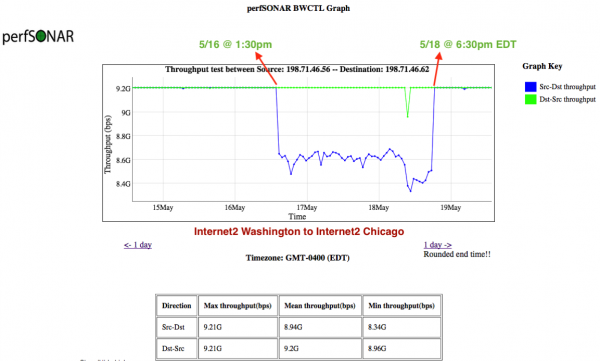
While not a smoking gun, there is a clear drop in performance that does not match the pattern of use. There is also a clear recovery where traffic returns to a higher level. Note that this was a weekend, so traffic load was already lower. Given that ESnet and GMU saw this problem (and traversed Internet2 to reach each other), it is plausible that there was data available via the Internet2 perfSONAR testing. Visiting the Internet2 perfSONAR instance (https://pas.net.internet2.edu/maddash-webui/) we observed the following between sections of their network. Note that the graph below is plotting UDP throughput, and does not degrade as much as the TCP numbers we see in the ESnet and GMU graph:
Also, we can look at the latency/packet loss numbers:
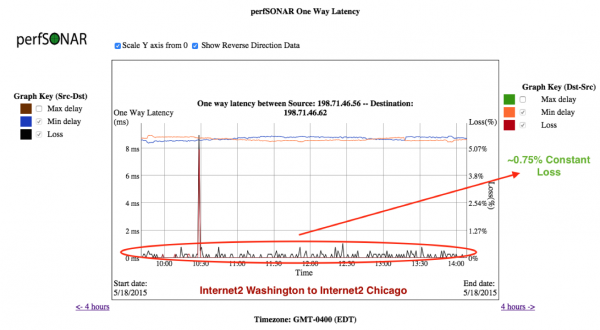
The results show a nearly 1% packet loss profile during the time of the issue, which reduced throughput (UDP and TCP). This outage was traced to a failing line card, which received a replacement as fast as possible.
This example goes to show that perfSONAR monitoring is invaluable for alerting when problems are occurring, even if they aren't on your network.