Brown University Example
Brown University Example
Scientific users at Brown University noticed that their routine data movement activities were slow in certain situations. In particular downloading data always seemed to go slow. The problem was particularly bad when they were interacting with sites that were physically separated by a great distance. Uploading data worked as expected in most situations. Upon complaining about the problem to their local networking staff, it was suggested to try a perfSONAR test. A machine was allocated, and deployed next to their scientific instrumentation (in this case a server that functioned with the GridFTP tool). This new perfSONAR resource would travel the same path to the outside world that the science data would take. A test was devised with a remote site, in this case the University of Colorado at Boulder. The graphic below shows the observations that perfSONAR gathered over the course of a week:
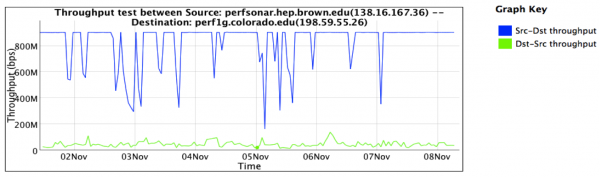
This observation shows two things:
- Performance in the download direction (e.g. CU pushing data to Brown) was severely impacted. This is represented as the green line in the graph. Performance hovered around 50Mbps at all times.
- Performance in the upload direction (e.g. Brown pushing data to CU) was within acceptable levels most of the time. This is represented as the blue line in the graph. Observations showed that 900Mbps was possible (for a 1Gbps connected machine) with some dips observed periodically.
Using these observations as a basis, an investigation was started within the Brown University network. It was decided that the best way to figure out if this was a Wide Area problem (e.g. something outside of the campus control) versus a Local Area problem (something within the control of Brown University) was to set up another perfSONAR test at the border of the campus. On the diagram below, a second perfSONAR server was allocated bear the border:
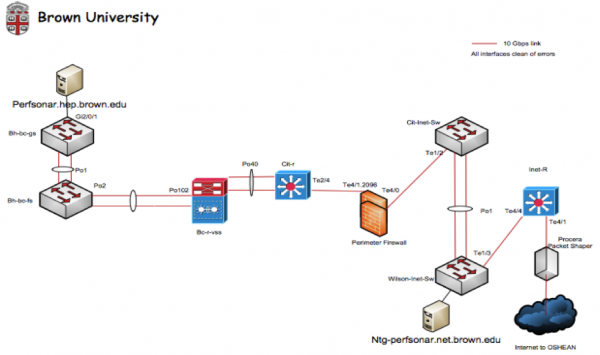
A similar set of tests was established, also testing against the resource at the University of Colorado. After a couple of days of testing, the following graph was captured:
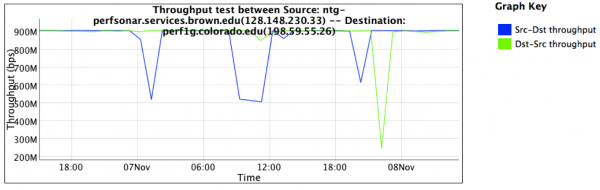
Observations from this graph are:
- Both directions to the University of Colorado (download and upload, represented by the blue and green lines) are performing at expected levels. Observation shows performance of at least 900Mbps, with occasional dips.
- The only differences between the placement of this perfSONAR server, and the one near the scientific users, are some switching devices and a firewall
Given these results, the conclusion is made that there is a problem within the Brown University campus network, and not a problem in the Wide Area. This is a powerful bit of debugging because:
- It is tempting to think that on a long path, the problems observed between a local resource and a remote resource must be somewhere far away. As demonstrated in TCP Loss Explained, TCP performs well over a short distance, and worse as the latency increases.
- By revealing that the problem is not on the majority (90% or more) of the path, more time can be spent analyzing the local issues.
- By revealing the problem is local, there is no need to involve regional, national, or remote resources to debug a non-existent issue
The staff at Brown now knows to look between the nodes to find the problem. There are several possible courses of action:
- Investigate the load on the links between the resources, to see if anything is overly congested
- Investigate the buffer settings of all switches and firewalls in the path, to see if they are large enough to support the Bandwidth Delay Product. As a reminder, the Bandwidth Delay Product (BDP) is a function of the latency, available memory, and expectation of bandwidth. A helpful calculator can be found here: https://www.switch.ch/network/tools/tcp_throughput/. For example, to be able to achieve a bandwidth of 1Gbps over an 80ms path, there needs to be at least 10MB of buffer available at each hop in the path to facilitate TCP's operation. If any part of the path doesn't have this much memory, it will be impossible to reach the bandwidth expectation. In fact each hop should have significantly more buffer available, to facilitate the use by other flows that will no doubt be passing through the interface.
- Investigate the performance of the firewall, to determine if it is
- Taking too long to process packets, thus causing TCP to time out and re-send data
- Manipulating packet headers to adjust the requested window size, thus keeping throughput low
The next course of action was to look at a live test, to see what was happening to the packet train. This will give more data to the moment by moment behavior of the flow. First the download direction was tried from the border device:
nuttcp -T 10 -i 1 -p 10200 bwctl.newy.net.internet2.edu
   92.3750 MB /   1.00 sec =  774.3069 Mbps     0 retrans
  111.8750 MB /   1.00 sec =  938.2879 Mbps     0 retrans
  111.8750 MB /   1.00 sec =  938.3019 Mbps     0 retrans
  111.7500 MB /   1.00 sec =  938.1606 Mbps     0 retrans
  111.8750 MB /   1.00 sec =  938.3198 Mbps     0 retrans
  111.8750 MB /   1.00 sec =  938.2653 Mbps     0 retrans
  111.8750 MB /   1.00 sec =  938.1931 Mbps     0 retrans
  111.9375 MB /   1.00 sec =  938.4808 Mbps     0 retrans
  111.6875 MB /   1.00 sec =  937.6941 Mbps     0 retrans
  111.8750 MB /   1.00 sec =  938.3610 Mbps     0 retrans

 1107.9867 MB /  10.13 sec =  917.2914 Mbps 13 %TX 11 %RX 0 retrans 8.38 msRTT
Then the download direction was tried from next to the science users. The result shows several interesting pieces of information:
nuttcp -r -T 10 -i 1 -p 10200 bwctl.newy.net.internet2.edu
    4.5625 MB /   1.00 sec =   38.1995 Mbps    13 retrans
    4.8750 MB /   1.00 sec =   40.8956 Mbps     4 retrans
    4.8750 MB /   1.00 sec =   40.8954 Mbps     6 retrans
    6.4375 MB /   1.00 sec =   54.0024 Mbps     9 retrans
    5.7500 MB /   1.00 sec =   48.2310 Mbps     8 retrans
    5.8750 MB /   1.00 sec =   49.2880 Mbps     5 retrans
    6.3125 MB /   1.00 sec =   52.9006 Mbps     3 retrans
    5.3125 MB /   1.00 sec =   44.5653 Mbps     7 retrans
    4.3125 MB /   1.00 sec =   36.2108 Mbps     7 retrans
    5.1875 MB /   1.00 sec =   43.5186 Mbps     8 retrans

   53.7519 MB /  10.07 sec =   44.7577 Mbps 0 %TX 1 %RX 70 retrans 8.29 msRTT
We see many TCP retransmissions, this can be a symptom of:
- Packet loss, caused by lack of buffering in the path
- Packet loss, caused by physical errors (e.g. CRC)
- Packet loss, caused by TCP timeouts
The first two items are easily checked on a network:
- Each device was verified to see that buffering was sufficient for the flow expectation. All devices were found to have enough buffer
- Each device was checked (using SNMP) to see that they were:
- Not over capacity (e.g. using utilization counters on the interfaces)
- Were not discarding packets (e.g. using the discard counters on the interfaces)
- Were not seeing packet errors (e.g. using error counters on the interfaces)
- While not attempted, it is important to do the above on lower level devices too. For example, if the optical and physical layer of your network is delivered via different machines, check the counters on these as well.
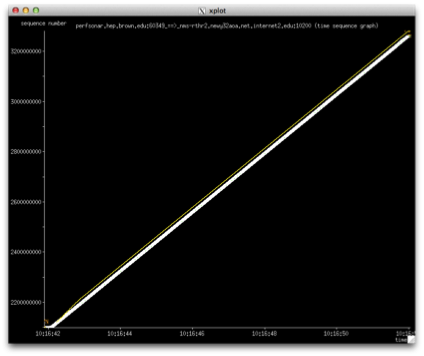
The items that remains is the performance of the firewall. It should be noted that this particular model did not feature a rich interface that allowed SNMP like access to the interfaces, there was no way to tell if packets were being dropped by the device itself. In situations where there is no visibility into how something is behaving, it is necessary to use more advanced tools to determine behavior. It was decided to run a TCPDump/TCPTrace on each of the perfSONAR nodes as they ran a test (similar to the examples above). A full treatment on how to use these tools can be found here: TCPDump/TCPTrace.
The first graph shows what it looks like in the direction that is not being impacted. We see a very clean throughput line, no TCP retransmissions and the window grows without issue:
In the impacted direction, we produce a graph that looks like this:
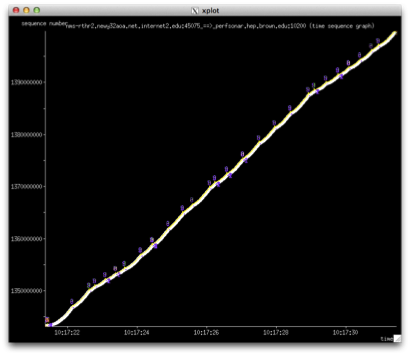
There are several things to note about this graph:
- We several instances (3-5 times per second over the course of a 10 second test) where the transmission is stalled
- Each stall in transmission appear as a series of events (these can be better seen in the next graph):
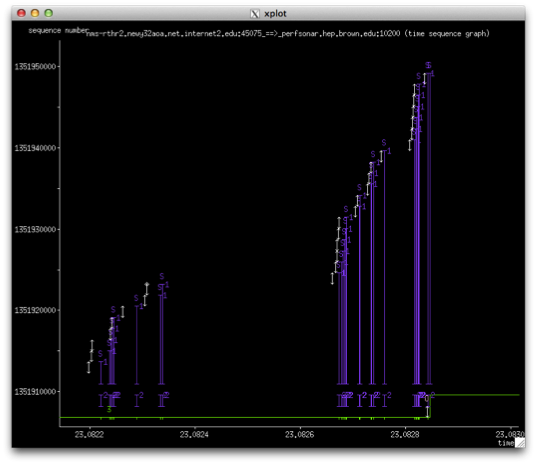
- A SACK is sent to signal the TCP sender that a packet was missing. TCP will do this to prevent having to re-send the entire window
- After 3 such events (e.g. when the same packet is ACKed 3 times in a row - a triple duplicate acknowledgement - it is necessary to resend the entire window for fear that there has been packet loss in the network
- The indication that some packets were seen out of order, typically this happens when there is a duplication of packets or a single packet is being held up and delivered in the wrong order
- TCP spends so much time trying to maintain its window during these events, that it never grows. In this case the window is limited to between 64KB and 512KB. With a window this small (due to having ot deal with the packet loss) throughout is reduced to be in the 50Mbps range, and is never stable
The next graph shows a larger view of an individual moment in the length of the transfer:
The firewall became the chief suspect int his incident. It was never fully understood, but there are several possible theories:
- The buffering on the ingress and egress firewall ports was insufficient, and resulted in packet loss within the machine itself. There were no SNMP counters to validate this
- The time the firewall took to process a packet (e.g. the time it took to extract the header, validate the source/destination/port were on a white list and allowed by the state table) caused stalls in the TCP flow, which resulted in SACK and window re-sending behavior. The TCP trace seemed to back this up the most.
- Packets were being incorrectly marked, and thus dropped, but the internals of the firewall. In this case no log is kept to indicate this is happening, but it could explain the lost packets on an end to end basis
The verdict is that a firewall of this nature is too limiting for high intensity traffic, as in the kind used for GridFTP transfers. The local networking staff implemented Science DMZ approaches, and migrated the science data to a dedicated network, one that offered the same level of security without traversing the data plane of the firewall.