Long Distance Troubleshooting
Long Distance Troubleshooting Example
Most Wide Area debugging exercises start the same way - indication that there is a problem between two sites. Most network users don't know (and are unable to easily find) the details of the network path between the resources they are using. Indeed, many networks do not publish maps, or may refuse to provide them when asked. However, perfSONAR provides tools which can help understand the path, and we can use tools to help us draw a map and solve the problem.
In the example below we have two sites. One is a National Laboratory and the other is a Campus. The campus reports that it is having trouble downloading data from the National Laboratory. The Lab and University both have a good idea of their local network (and can provide a diagram when talking to each other), but they don't have a detailed understanding of the wide area path between them. Let's start with the first map, a view of each site having the problems and a clear indicator which direction is having a hard time. We can draw the things we don't know about as a cloud for now:
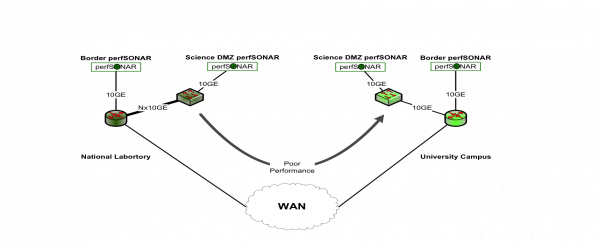
How can we tell what is in the middle? We would typically use the traceroute tool, but this is only good about giving us a single direction, and without perfSONAR we need to have a login on the host where we wish to run traceroute. perfSONAR has a special tool that allows us the ability to run a traceroute between any pair of perfSONAR servers, and we don't need to be logged in to either. Consider these examples:
[USER@HOST1 ~]$ pscheduler task trace --source HOST1 --dest HOST2
Submitting task...
Task URL:
https://HOST1/pscheduler/tasks/e65ea249-5ee9-41b7-a240-28005f9cc912
Running with tool 'traceroute'
Fetching first run...
Next scheduled run:
https://HOST1/pscheduler/tasks/e65ea249-5ee9-41b7-a240-28005f9cc912/runs/c78545c8-f160-4006-b52c-359a1cabf4c0
Starts 2018-05-03T09:11:30-07:00 (~7 seconds)
Ends 2018-05-03T09:11:38-07:00 (~7 seconds)
Waiting for result...
1 HOST1 (i.i.i.i) AS291 0.3 ms
ESNET
2 ESNET.LINK.7 (h.h.h.h) AS293 21.9 ms
ESNET
3 ESNET.LINK.6 (g.g.g.g) AS293 22.3 ms
ESNET
4 ESNET.LINK.5 (f.f.f.f) AS293 33.6 ms
ESNET
5 ESNET.LINK.4 (e.e.e.e) AS293 43.6 ms
ESNET
6 ESNET.LINK.3 (d.d.d.d) AS293 64.5 ms
ESNET
7 ESNET.LINK.2 (c.c.c.c) AS293 67.6 ms
ESNET
8 ESNET.LINK.1 (b.b.b.b) AS292 68.9 ms
ESNET
9 LAB.LINK.1 (a.a.a.a) ASaaaa 68.8 ms
LABORATORY NETWORK
10 HOST2 ASaaaa6 68.3 ms
LABORATORY NETWORK
No further runs scheduled.
This gives us the path between the ESnet perfSONAR test host in Boston and the perfSONAR test host at the NERSC supercomputer center in Berkeley CA.
[USER@HOST1 ~]$ pscheduler task trace --source HOST2 --dest HOST1
Submitting task...
Task URL:
https://HOST2/pscheduler/tasks/cd7f05fc-5027-4103-8a3f-48a194c08699
Running with tool 'traceroute'
Fetching first run...
Next scheduled run:
https://HOST2/pscheduler/tasks/cd7f05fc-5027-4103-8a3f-48a194c08699/runs/b72e9b68-c96e-44ed-9738-74f3aad76754
Starts 2018-05-03T09:14:13-07:00 (~7 seconds)
Ends 2018-05-03T09:14:21-07:00 (~7 seconds)
Waiting for result...
1 HOST2 ASaaaa 0.1 ms
LABORATORY NETWORK
2 LAB.LINK.1 (a.a.a.a) ASaaaa 0.5 ms
LABORATORY NETWORK
3 ESNET.LINK.1 (b.b.b.b) AS292 1.9 ms
ESNET
4 ESNET.LINK.2 (c.c.c.c) AS293 4.5 ms
ESNET
5 ESNET.LINK.3 (d.d.d.d) AS293 25.5 ms
ESNET
6 ESNET.LINK.4 (e.e.e.e) AS293 36.1 ms
ESNET
7 ESNET.LINK.5 (f.f.f.f) AS293 47.1 ms
ESNET
8 ESNET.LINK.6 (g.g.g.g) AS293 47.2 ms
ESNET
9 ESNET.LINK.7 (h.h.h.h) AS293 69 ms
ESNET
10 HOST1 (i.i.i.i) AS291 68.5 ms
ESNET
No further runs scheduled.
This second run, with source and destination hosts swapped, give us the other direction.
This illustrates an important capability. While logged on to a host that has a perfSONAR tool installed, we can run a traceroute between any two other perfSONAR hosts (provided those hosts permit such action, as most perfSONAR hosts on science networks do). This allows us to learn the layer 3 (network layer) path between the hosts. We can see the networks the path traverses, and get a rudimentary view of latency. There may be details that we don't get about the lower layers of the network, but it helps us to establish the networks in the path, and build a map of the path we need to debug.
Back to our example, we can use pScheduler to run the traceroute tool between the perfSONAR nodes at the Lab and University and we determine the network path:
- Lab LAN
- ESnet
- Internet2
- Regional Network
- Campus LAN
We can be as detailed as possible, and try to indicate the number of hops and devices we cross, along with estimations of the latency. How can we get the exact latency numbers? We will use ping. As in the example above, ping usually is only helpful if we are on one of the hosts. We use perfSONAR to measure the round trip time between the two hosts:
[USER@HOST1 ~]$ pscheduler task rtt --source HOST2 --dest HOST1
Submitting task...
Task URL:
https://HOST2/pscheduler/tasks/de70dace-e615-4ac5-92c0-d1ff06fe7573
Running with tool 'ping'
Fetching first run...
Next scheduled run:
https://HOST2/pscheduler/tasks/de70dace-e615-4ac5-92c0-d1ff06fe7573/runs/14b23220-6c40-4069-81fa-7b6a469a674f
Starts 2018-05-03T09:20:56-07:00 (~7 seconds)
Ends 2018-05-03T09:21:07-07:00 (~10 seconds)
Waiting for result...
1 HOST1 (a.b.c.d) 64 Bytes TTL 55 RTT 68.3000 ms
2 HOST1 (a.b.c.d) 64 Bytes TTL 55 RTT 68.3000 ms
3 HOST1 (a.b.c.d) 64 Bytes TTL 55 RTT 68.4000 ms
4 HOST1 (a.b.c.d) 64 Bytes TTL 55 RTT 68.3000 ms
5 HOST1 (a.b.c.d) 64 Bytes TTL 55 RTT 68.6000 ms
0% Packet Loss RTT Min/Mean/Max/StdDev = 68.314000/68.413000/68.641000/0.310000 ms
No further runs scheduled.
And in the opposite direction:
[USER@HOST1 ~]$ pscheduler task rtt --source HOST1 --dest HOST2
Submitting task...
Task URL:
https://HOST1/pscheduler/tasks/b713edc5-d489-40bb-9a7d-a13544726ae5
Running with tool 'ping'
Fetching first run...
Next scheduled run:
https://HOST1/pscheduler/tasks/b713edc5-d489-40bb-9a7d-a13544726ae5/runs/7e737d1d-36c5-47da-9d4d-4e8873ec14c3
Starts 2018-05-03T09:24:37-07:00 (~8 seconds)
Ends 2018-05-03T09:24:48-07:00 (~10 seconds)
Waiting for result...
1 HOST2 (e.f.g.h) 64 Bytes TTL 55 RTT 68.3000 ms
2 HOST2 (e.f.g.h) 64 Bytes TTL 55 RTT 68.3000 ms
3 HOST2 (e.f.g.h) 64 Bytes TTL 55 RTT 68.3000 ms
4 HOST2 (e.f.g.h) 64 Bytes TTL 55 RTT 68.6000 ms
5 HOST2 (e.f.g.h) 64 Bytes TTL 55 RTT 68.5000 ms
0% Packet Loss RTT Min/Mean/Max/StdDev = 68.339000/68.448000/68.615000/0.308000 ms
No further runs scheduled.
While logged on to a host that has a perfSONAR tool installed, we can measure the round trip time (or "latency") between any two other perfSONAR hosts.
With these two tools, we can learn a lot about the network - but what we really need to know is where there may be more perfSONAR hosts located. Ideally we want to know if there is a host at each hop along our path. The perfSONAR consortium maintains an extensive directory of perfSONAR resources, each node will register to this when it comes online. To view a portion of this, visit the following web site:
http://stats.es.net/ServicesDirectory/
This GUI allows us to ask questions about perfSONAR nodes. E.g. where they are deployed, what services they are running. With our traceroute information above, we know which networks to search for hosts. Using traceroute and ping, we then start to fill out a new graph that shows several things:
- The semi-exact layer 3 path between the problem hosts
- The location of perfSONAR nodes along the path
- The relative latencies between perfSONAR nodes, and domains
The new map appears below:
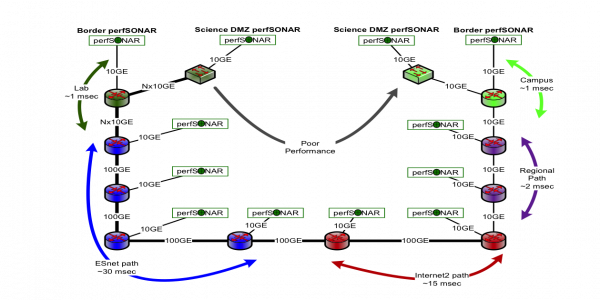
With this in place, we can now focus on debugging. One may be tempted to try to debug each link directly: this is the worst way to approach the problem. Remember that TCP dynamics will be different depending on the latency between the ends. According to our packet loss graph (https://fasterdata.es.net/network-tuning/tcp-issues-explained/packet-loss/) we only start to see that packet loss is an issue as the latency increases. Debugging the links within a campus, where the latency is 1ms, won't be very productive, we will usually see high throughput, even if there are problems. For example, if we tested between the Border and DMZ perfSONAR nodes on either campus, we should see close to line rate performance, even with some packet loss.
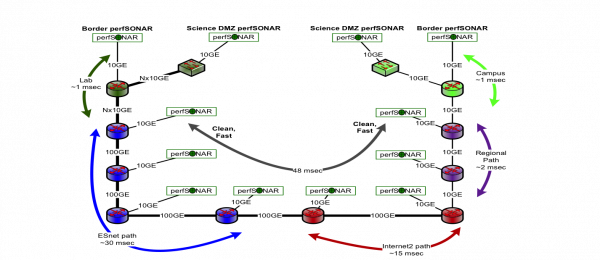
Because TCP will react differently as latency increases we need to develop a new strategy: find the path that is longest and also highest performing. This may seem counter intuitive, e.g. looking far away from a problem to try to fix it, but we are using the weakness of TCP (performance sensitivity to packet loss) to our advantage.
In the map below, it was shown that ESnet to the regional, crossing Internet2, a path of 47ms, was completely clean in each direction:
However, once we go into the University network, performance falls - but only in one direction:
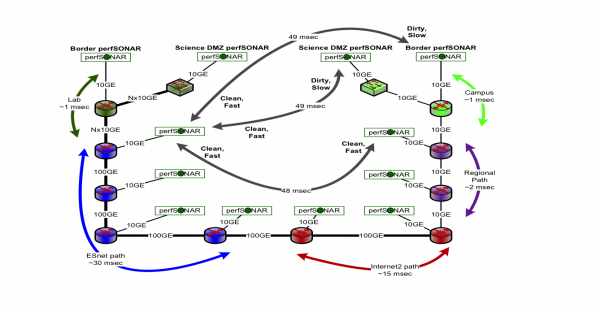
What can we say at this point:
- The long path between the University and the Lab (crossing ESnet, Internet2, and the Regional) shows dirty downloads (e.g. Lab -> University).
- The long path between ESnet, Internet2, and the Regional is completely clean - it shows fast performance in each direction
- The long path between the University and ESnet (crossing ESnet, Internet2, and the Regional) shows dirty downloads (e.g. ESnet -> University).
- Because of #2, we want to center our investigation within the campus, and between the campus and the regional (on the campus side).
How did we come to the conclusion in #4? TCP doesn't lie, a long path that performs well is free of errors. This can basically rule out the ESnet/Internet2/Regional portion. We now start to examine the setup on campus:
- Investigate SNMP to see if we see any counters that show high utilization, packet drops, or errors
- Check the settings on switches and routers in the path, to be sure they have enough memory to support high performance transfers (e.g. check the BDP calculator)
Investigation on the campus found the issue:
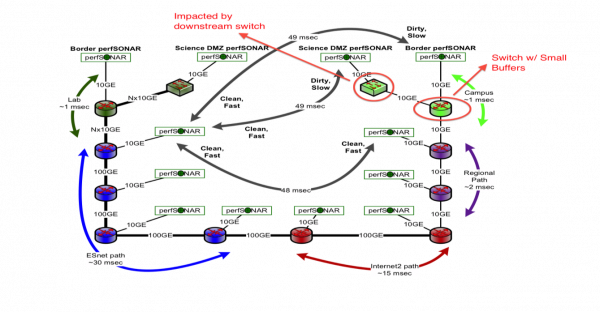
The border device was recently changed, and featured default settings on one of the interfaces. The lack of available buffering caused there to be a large number of dropped backs when people were downloading. Fixing the buffer caused performance to return back to a normal level.
This example is very detailed, but should give enough information to debug a long path problem.


