Debugging MTU Problems
Debugging MTU Problems
Debugging problems with Maximum Transmission Unit (MTU) can be challenging. Lets start with a definition (http://searchnetworking.techtarget.com/definition/maximum-transmission-unit):
A maximum transmission unit (MTU) is the largest size packet or frame, specified in octets (eight-bit bytes), that can be sent in a packet- or frame-based network such as the Internet. The Internet's Transmission Control Protocol (TCP) uses the MTU to determine the maximum size of each packet in any transmission.
The default for most network gear and operating systems (Linux, Windows, Macintosh) is to use an MTU of 1500 Bytes. In some installations, particularly those in the R&E world, the use of Jumbo Frames is common (http://searchnetworking.techtarget.com/definition/jumbo-frames):
A jumbo frame is an Ethernet frame with a payload greater than the standard maximum transmission unit (MTU) of 1,500 bytes. Jumbo frames are used on local area networks that support at least 1 Gbps and can be as large as 9,000 bytes.
Changing the MTU setting on a host and network does give some performance benefit:
- Goodput (e.g. application layer throughput: the amount of useful information delivered via the network per unit time) increases
- Protocol efficiency increases
- Networks that use tunneling/encapsulation (e.g. overlays such as VLANs or VRFs) require space in each packet. In a 1500 Byte network this means less room for the actual payload
Setting the MTU to 9000 Bytes must be done carefully. In particular:
- Ensure the network hardware can support larger frames, as well as the NIC and Operating Systems of the hosts
- It is a good idea to set network interfaces to the highest setting they will go, and not just stop at 9000. For instance it is common for some network devices to support sizes of up to (or beyond) 9216. This is often called the Robustness Principle, or Postel's Law (after Jon Postel's work in TCP):
- Be conservative in what you do, be liberal in what you accept from others (often reworded as "Be conservative in what you send, be liberal in what you accept")
- Hosts do not need to follow this rule, and should be set to 9000 only
- The MTU value must match all the devices connected to that layer 2 network. Simply stated - anything in the broadcast domain needs to be using the same MTU or things will cease working.
Once you set your network to be 9000 bytes, its a good idea to check to be certain you can still reach the outside world. Ping and tracepath will be the tools you want to use. For example, we should be able to pass a 9000 byte packet end to end:
[user@host ~]# ping -s 8972 -M do -c 4 perfsonar02.hep.wisc.edu
PING perfsonar02.hep.wisc.edu (144.92.180.76) 8972(9000) bytes of data.
8980 bytes from perfsonar02.hep.wisc.edu (144.92.180.76): icmp_seq=1 ttl=60 time=22.6 ms
8980 bytes from perfsonar02.hep.wisc.edu (144.92.180.76): icmp_seq=2 ttl=60 time=22.6 ms
8980 bytes from perfsonar02.hep.wisc.edu (144.92.180.76): icmp_seq=3 ttl=60 time=22.6 ms
8980 bytes from perfsonar02.hep.wisc.edu (144.92.180.76): icmp_seq=4 ttl=60 time=22.6 ms

--- perfsonar02.hep.wisc.edu ping statistics ---
4 packets transmitted, 4 received, 0% packet loss, time 3026ms
rtt min/avg/max/mdev = 22.621/22.639/22.684/0.109 ms
We can also use tracepath to verify the entire path (note we will be looking for the point where things step down from 9000 in the event of a problem):
[user@host ~]# tracepath perfsonar02.hep.wisc.edu
 1?: [LOCALHOST]     pmtu 9000
 1:  lhcone-wash-opt1-gw.es.net (198.124.80.202)            0.827ms
 1:  lhcone-wash-opt1-gw.es.net (198.124.80.202)            0.481ms
 2:  esnet-lhc1-uwmadison.es.net (198.124.80.101)          17.939ms
 3:  uwmadison-lhc1-esnet.es.net (198.124.80.102)          24.260ms
 4:  no reply
 5:  perfsonar02.hep.wisc.edu (144.92.180.76)              22.651ms reached
     Resume: pmtu 9000 hops 5 back 5
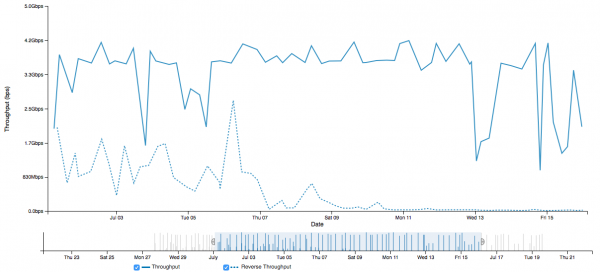
Regular monitoring also has a way of letting us know when there is a problem. Consider the graph below - things were working reasonably well until performance suddenly (and clearly) degraded:

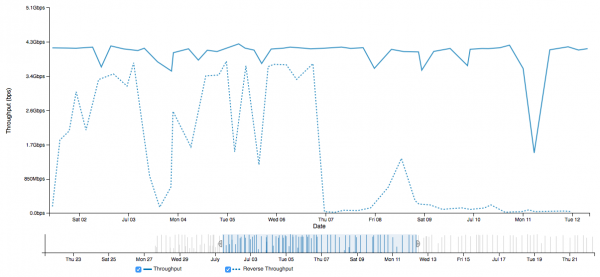
Note that if we are debugging a problem of this nature, we want to see if the problem exists to other hosts as well. In this case all of the tests this host was making saw the same degraded pattern around the same time:

We may be tempted to think this is packet loss, or something else within the common network path. Checking the MTU setting locally is a fast bit of debugging we can do, and it behooves us to try that first. First, let's try to pass some ping packets. We want to start at a known value, and slowly work our way up to find what the MTU setting could be. For example this may be the largest we can get through:
[user@host ~]# ping -s 1476 -M do -c 4 perfsonar02.cmsaf.mit.edu
PING perfsonar02.cmsaf.MIT.edu (18.12.1.172) 1476(1504) bytes of data.
1484 bytes from perfsonar02.cmsaf.mit.edu (18.12.1.172): icmp_seq=1 ttl=57 time=13.4 ms
1484 bytes from perfsonar02.cmsaf.mit.edu (18.12.1.172): icmp_seq=2 ttl=57 time=13.4 ms
1484 bytes from perfsonar02.cmsaf.mit.edu (18.12.1.172): icmp_seq=3 ttl=57 time=13.4 ms
1484 bytes from perfsonar02.cmsaf.mit.edu (18.12.1.172): icmp_seq=4 ttl=57 time=13.4 ms

--- perfsonar02.cmsaf.MIT.edu ping statistics ---
4 packets transmitted, 4 received, 0% packet loss, time 3018ms
rtt min/avg/max/mdev = 13.425/13.449/13.482/0.023 ms
Going one Byte higher produces an error:
[user@host ~]# ping -s 1477 -M do -c 4 perfsonar02.cmsaf.mit.edu
PING perfsonar02.cmsaf.MIT.edu (18.12.1.172) 1477(1505) bytes of data.

--- perfsonar02.cmsaf.MIT.edu ping statistics ---
4 packets transmitted, 0 received, 100% packet loss, time 12999ms
From this data we can tell that even though the host is set to 9000, we cannot get 9000 byte packets end to end. Finally, we can look at a live iperf test results, to see what the actual behavior of the link happens to be.
SENDER START
Connecting to host 198.124.80.193, port 5662
[ 15] local 18.12.1.172 port 44329 connected to 198.124.80.193 port 5662
[ ID] Interval           Transfer     Bandwidth       Retr  Cwnd
[ 15]   0.00-1.00   sec  87.4 KBytes  0.72 Mbits/sec    2   26.2 KBytes
[ 15]   1.00-2.00   sec  0.00 Bytes  0.00 Mbits/sec    1   26.2 KBytes
[ 15]   2.00-3.00   sec  0.00 Bytes  0.00 Mbits/sec    0   26.2 KBytes
[ 15]   3.00-4.00   sec  0.00 Bytes  0.00 Mbits/sec    1   26.2 KBytes
[ 15]   4.00-5.00   sec  0.00 Bytes  0.00 Mbits/sec    0   26.2 KBytes
[ 15]   5.00-6.00   sec  0.00 Bytes  0.00 Mbits/sec    0   26.2 KBytes
[ 15]   6.00-7.00   sec  0.00 Bytes  0.00 Mbits/sec    1   26.2 KBytes
[ 15]   7.00-8.00   sec  0.00 Bytes  0.00 Mbits/sec    0   26.2 KBytes
[ 15]   8.00-9.00   sec  0.00 Bytes  0.00 Mbits/sec    0   26.2 KBytes
[ 15]   9.00-10.00  sec  0.00 Bytes  0.00 Mbits/sec    0   26.2 KBytes
- - - - - - - - - - - - - - - - - - - - - - - - -
[ ID] Interval           Transfer     Bandwidth       Retr
[ 15]   0.00-10.00  sec  87.4 KBytes  0.07 Mbits/sec    5             sender
[ 15]   0.00-10.00  sec  0.00 Bytes  0.00 Mbits/sec                  receiver

iperf Done.

SENDER END
This is a very common pattern when the MTU is broken:
- Several packets get through in the start as negotiation begins for the connection
- Since both sides think they are using 9000 bytes frames (e.g. if both hosts are configured for 9000, but there is a back hole in the middle) that is the size that will be used
- As the transfer starts, the packets are blocked by the lack of MTU support somewhere in the middle
- The result is always a very low number, and 87.4KB is very common (the number of packets that try to make it through during MTU negotiation)
In general, be careful with your MTU settings and always debug using the tools above to find problems.


